Context
I’ve just submitted my thesis manuscript (yay!). I now have plenty of free time and plenty of half-finished blog posts. For this one, I’ll stay in the machine-learning/experiments/PhD domain to talk a bit about how my approach to experiments evolved over three years, particularly how I managed tracking results. My PhD was very much, experiments-oriented, meaning every week we had new ideas to test or small changes to perform, and then, evaluate. Each of these pretty much followed the same cycle as shown below.
My research workflow.
At first, my experiments were small and simple. I could keep track of their results using a few results.csv files. Then came a point where collecting and analysing results became a recurring error-prone exercise as I was checking which jobs were still running, fetching logs from different places (desktop, laptop, cluster nodes, … ), and praying that I correctly merged everything together.
Consequently, I needed a centralized way to record each experiment’s settings and results more rigorously. Since I was working with machine learning, the two obvious candidates were Weights & Biases and MLflow. Both let you add metric- and metadata-logging calls to your code, then inspect and query the results for analysis through a web view or an API. Weights & Biases is primarily a hosted service with free and paid plans, while MLflow is open source and can be self-hosted. I’m all in for self-hosting, so I chose MLflow.
Before MLflow, my jobs were monitored by hand and results were managed manually, which was error-prone. With MLflow, everything is centralized, which makes evaluations faster and more reliable.
My point in this post is that if you’re joining a PhD or starting a project with plenty of experiments, you’ll want a clean way to record their settings, their results, and probably how to reproduce them. In such a case, I think that MLflow should be considered. To show why, I’ll walk through how I use MLflow in my research workflow and how it makes tracking experiments and analysing their results easier. I’ll try to keep this at a high level as plenty of good introductory tutorials already exists for that, such as the DTU-MLOps course or the MLflow Tracking documentation. Also, I won’t focus on how to self-host this service, as MLflow provides good documentation on how to do so using either Docker or the mlflow command: Self-hosting MLflow.
MLflow in a Nutshell
MLflow helps keep experiment settings and results in one place. Your experiment code sends this data to a central tracking server as it runs, and you can then inspect it through the web UI or query it through the API. For experiments, it helps to reproduce and compare results to understand how different parameters or model architectures affect performance. For deployment, it supports packaging models, managing their versions, and deploying them. Lately, with the growth of LLMs, it also evolved to provide tools for tracing and evaluating LLM applications and managing prompts. For research (and I’ll focus on that part in this post) the highly practical features are the tracking and reproducible ones.
For tracking, MLflow organizes data as follows. For each evaluation you want to conduct, you create an experiment. Within it, runs represent individual executions of code. A run keeps the configuration of that execution as parameters, its results as metrics, and files such as figures, traces and fitted models as artifacts. Nested runs are a practical feature: when comparing classification methods in one experiment, you could use a parent run for a detection method and child runs to evaluate it in different settings.
How an experiment, its parent runs and their child runs relate to each other in MLflow.
We’ll take a text classification task, spam detection, as a running example to illustrate the article. In the figure above, we present the mental model of how results are structured in MLflow. Here, the “text-classification” experiment contains two parent runs: an autoencoder using RoBERTa features and a OneClassSVM using CountVectorizer features. Each has three child runs for different evaluation scenarios (each one holds out a different domain during training), along with an AUROC score and a model file when the run is successful, and its log in all cases.
Logging Runs from Anywhere
Typically, whenever I want to evaluate a new idea or a new change, I start by defining an experimental protocol. An experimental protocol identifies what should be measured (which metrics?) and under which conditions (which baselines, settings and benchmarks?). For me, the result of this step is typically a textual file detailing the protocol, with links to other papers or works that used the same benchmark, references explaining why the chosen metrics or other design choices are appropriate.
Such a document is useful both for my final paper and for guiding the implementation of the experiment (notably nowadays with AI coding agents). For instance, for our spam detection task, it could look like this:
# Protocol: spam detection across domains

## Research question
How well do existing unsupervised spam detection methods perform on an unseen domain during training ?

## Existing Methods
- OneClassSVM with CountVectorizer features [paper]
- Autoencoder with RoBERTa features [paper]
Hyperparameters: as reported in the original papers.

## Benchmarks
Train on two domains, test on the held-out one (leave-one-domain-out scenario):
- scenario-1: sms-spam held out [link]
- scenario-2: youtube-spam held out [link]
- scenario-3: enron-spam held out [link]

## Metrics
- AUROC and AUPRC are the standard metrics to report in unsupervised settings [paper]
Defining that experimental protocol directly guides how MLflow can be used in my workflow: it specifies which runs will be executed, which evaluation settings to record for each, and which metrics to collect. In other words, the cost of deciding what to track is very low because the data that should be collected is already identified. Another cost of using MLflow is adding client-side logging code to my experiments. In my experience, AI coding agents have lately been very good at writing this kind of code, especially since, logging code is very structured and not very complex (just, a bit verbose sometimes). Typically, I give the experimental protocol file to Claude code so it correctly knows what data should be tracked, which makes the cost of integrating tracking code in the codebase negligible in practice.
Beyond this experiment-specific information, MLflow also supports recording code commits and datasets, which is useful for reproducibility. For the code, MLflow records the repository and commit SHA automatically when the script runs from a Git repository, which identifies the version used for a run. For datasets, MLflow allows tracking the source and a fingerprint.
For our running example, the tracking code could look like this. We would first open a parent run for each method, then dispatch each of its scenarios as a job on a different cluster node:
mlflow.set_experiment("text-classification")

methods = [("Autoencoder", "RoBERTa"), ("OneClassSVM", "CountVectorizer")]

for classifier, extractor in methods:
    tags = {"decision_engine": classifier, "feature_extractor": extractor}
    name = f"{classifier} and {extractor}"
    with mlflow.start_run(run_name=name, tags=tags) as parent:
        for scenario in scenarios:  # one cluster job each
            dispatch(run_scenario, parent.info.run_id, tags, scenario)
In the snippet below, each job then opens a child run under that parent. By providing the correct environment variables, all jobs reach the same MLflow tracking server and experiment. Each child run records its settings as tags and parameters, the training and testing datasets it used, the losses at each epoch, the final AUROC and AUPRC, each test message’s true label and prediction score, and the trained model. Specifically, for each dataset, MLflow expects a dataset object. Here we create it from scratch by manually specifying metadata (hence, MetaDataset): the source URL and a hash of the data. Finally, something I find critical for observability is to always upload the job log to the server to investigate failures. Here, the finally clause ensures that a failed run still keeps its full log.
def run_scenario(parent_id, tags, scenario):  # on a node
    model, (train, test) = build_model(tags), scenarios[scenario]
    with mlflow.start_run(run_name=f"scenario-{scenario}", parent_run_id=parent_id):
        try:
            mlflow.set_tags({**tags, "scenario": scenario, "node": hostname})
            mlflow.log_params(model.config)
            for data, context in ((train, "training"), (test, "testing")):
                mlflow.log_input(MetaDataset(HTTPDatasetSource(data.url), name=data.name,
                                             digest=data.sha256[:8]), context=context)

            for epoch, losses in model.fit(train):
                mlflow.log_metrics(losses, step=epoch)

            auroc, auprc, scores = evaluate(model, test)
            mlflow.log_metrics({"auroc": auroc, "auprc": auprc})
            mlflow.log_table(scores, "test_scores.json")  # true label and score per message

            if tags["decision_engine"] == "Autoencoder":
                mlflow.pytorch.log_model(model, name="model")
            else:
                mlflow.sklearn.log_model(model, name="model")
        finally:
            mlflow.log_artifact("eval.log")
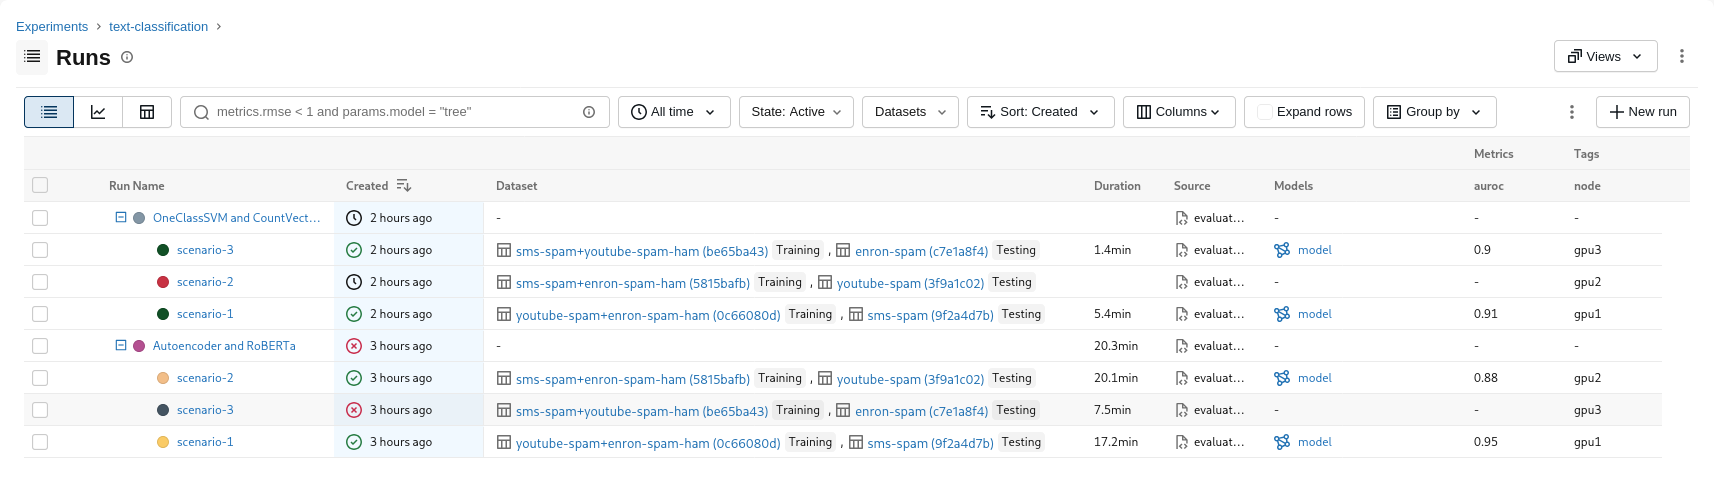
The screenshot below shows how these runs appear in MLflow, grouped by classification method. The status icons help monitor jobs across cluster nodes: here, the autoencoder evaluation with enron-spam held out has failed, while the OneClassSVM evaluation with youtube-spam held out is still running. For the successful runs, we asked MLflow to save the model. It did so along with information about its software environment (Python version and dependencies), so that one can recreate that environment, download and load the model for further evaluation or deployment.
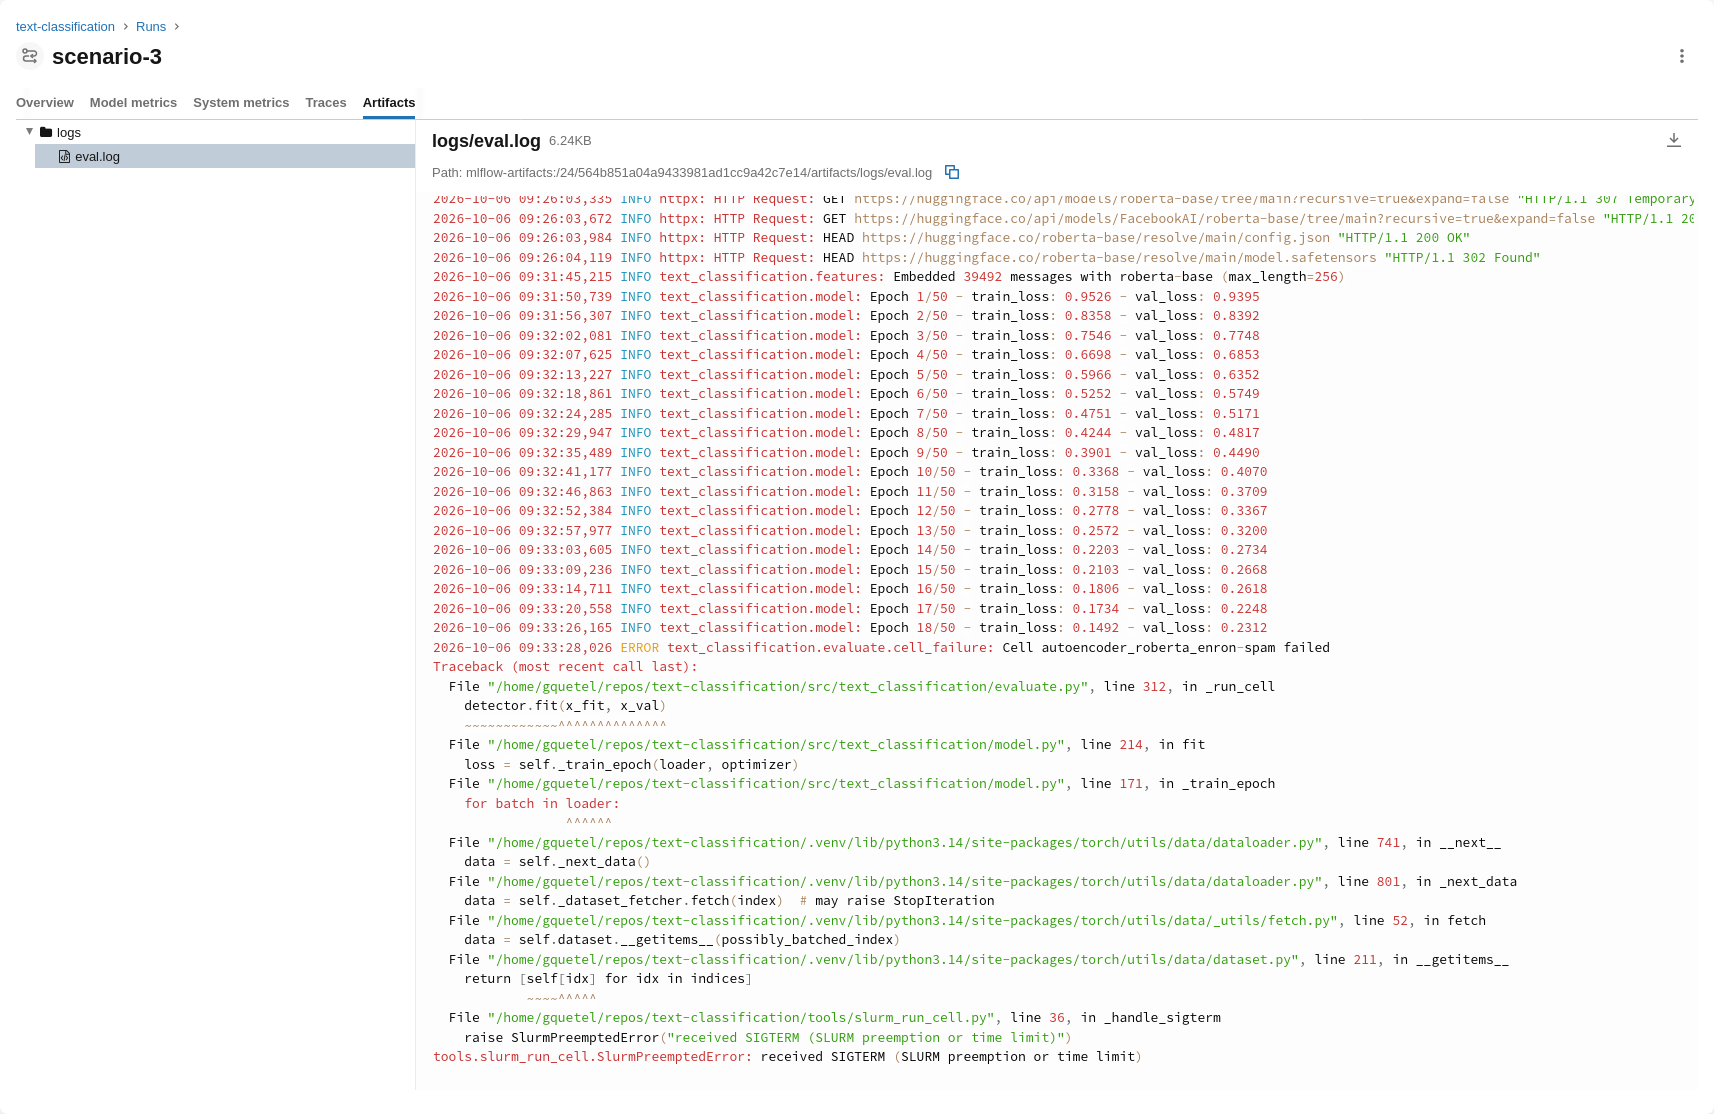
To investigate the failure, we can open the failed run and read the log that it uploaded as an artifact. Here, the traceback shows that SLURM stopped the job after 18 of its 50 epochs (preemption or time limit). Hence we only need to resubmit the job with a longer time limit.
Querying Results from Anywhere
Once evaluations have finished, results can be used to answer our initial research question. If you’ve ever thought “Oh no, my results are on another computer”, you’ll appreciate having them all on a central server. With MLflow, you can access your recorded results from any of your workstation.
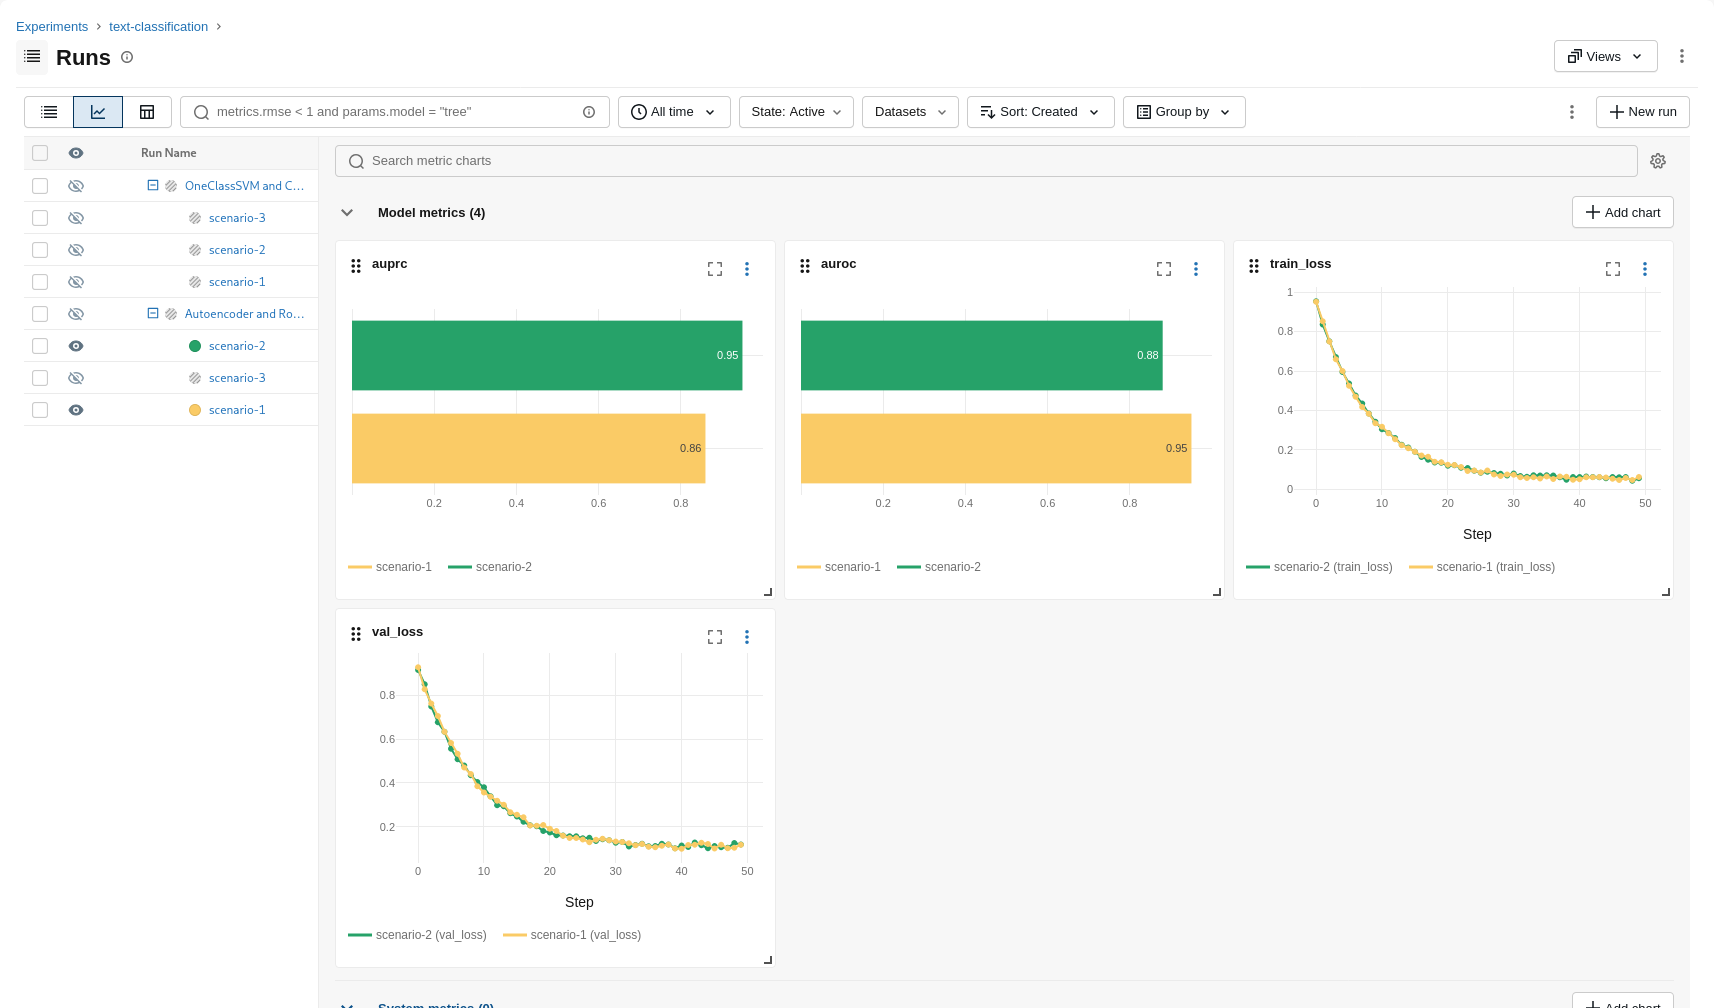
Here, we can very quickly look at the metrics we tracked through the web UI. Additionally, it provides some basic comparison and visualization tool to compare these metrics as shown below. Amongst other features, the interface allows to conditionally compare methods based on tags for more granular analysis (for instance, only comparing methods with a specific classifier). In the screenshot below, the two successful autoencoder evaluations are displayed together, showing their final scores and the evolution of their training and validation losses.
However, with many evaluated methods, the integrated visualisation pane or tables can be a bit tedious to process. We typically rely on specific visualisation libraries to plot these results. There, MLflow comes in handy again because its search API lets a script retrieve runs as a table containing their settings and metrics.
AI coding agent can also help write and revise these plotting scripts, and specifically the part to query the MLflow server (which again, can be a bit verbose to write). Most often, I would simply ask Claude to check a specific experiment and create a script to plot the results in a specific manner. For instance, once the failed evaluation is relaunched and the running one has finished, we could ask something like: “Plot from the text-classification experiment the ROC and precision-recall curves of each scenario, side by side”. And a few minutes later, we would have figures which we can analyse to answer our research question, such as the one below.
ROC and precision-recall curves of each method for scenario. Dashed lines: random detector (ROC) and prevalence of spam in the test set (precision-recall).
Some usage tips
Beyond the presented workflow above, a few habits have made my experiments tracking more efficient:
Recording enough context to investigate failures. I would encourage you to record the machine name, scheduler job ID, hardware details and relevant software versions alongside the job logs. These details help to tie a run to the cluster job responsible for it when the uploaded logs are not sufficient. Our research cluster has different GPUs and driver versions, and recording this information helped me identify which jobs had issues on specific nodes and why.
Saving detailed outputs as artifacts. Disk space is rarely an issue nowadays. Always prefer recording more data to having to rerun the experiments to recreate a figure. I would encourage you to upload any CSV or JSON files containing all the data required to correctly (re-)plot your figures. In our example, saving each test message’s true label and prediction score makes it possible to redraw ROC and precision-recall curves without rerunning the evaluation.
Managing dataset versions outside MLflow. Alright, this one is more of an MLOps best practice than a tip specific to MLflow, but recall the code snippet we used to illustrate how to register a dataset. There, we declared the metadata ourselves. Hence, if the recorded hash comes from an outdated source rather than the dataset actually used, changes can go unnoticed. So what I typically do is rely on a manifest file where I declare the expected hash of a dataset. Then I have a piece of code that loads the actual dataset file, computes its hash and compares it against the manifest. The job runs only if the hashes match; otherwise, it raises an error. On success, I log that hash. I believe that, for a more standard (but requiring more engineering) approach, DVC could be used.
Using tracked results to guide job submission. Every now and then, a job would fail for some reason (time limit, driver issue, …). Having a job orchestrator that I can simply ask to relaunch any failed job (after fixing the root cause) or submit any missing job is very practical. Querying MLflow run statuses came in very handy for this.
Conclusion
As my research experiments grew more complex, a robust tracking mechanism became necessary. MLflow is the tool I have relied on for a few years now, because it costs little to integrate into my existing research workflow and because having everything in one place is so convenient: each result stays connected to its settings, logs and artefacts, which makes it easier to analyse trends. Since results no longer have to be collected and merged by hand, each idea goes through its evaluation faster, and the next iteration of the research cycle can start sooner.
That said, I believe that the main cost of using MLflow is not the logging code but hosting the server. To me, self-hosting is more of a hobby than anything, so figuring out how to set it up correctly is part of the fun. With NixOS, this is made easier, and so are its management and updates. I reckon I have a fairly specific deployment of MLflow. The server is only accessible in my private Tailscale network, except for a specific upload endpoint which is required for cluster nodes to upload content. Cluster nodes access that endpoint using mTLS authentication, as I didn’t really want a fully web-facing MLflow instance.
For people who enjoy this part less, I believe that some Docker approaches exist, as shown in the MLflow documentation.
Beyond tracking, MLflow offers more features, including packaging projects and managing models and a lot of stuff revolving around GenAI. The project is actively maintained, and new features appear every few weeks to keep pace with the latter. If anything, I hope this article convinced you to drop those results.csv files and rely on this very practical piece of software. I’d be very happy to answer any of your questions about this software, so feel free to send me a message on any of my social media!
Banner image: Georges Lacombe. (Detail of) Les Moutons noirs (1893-1894).